Dear Doc:
Our sales team is getting ready for a presentation next week where we will be pitching our products and services to a potential customer. It is not an exaggeration to say that the stakes are high – skyscraper high. Maybe that’s why we keep arguing over how many graphs and charts to include. Some say less is more, others want to include everything we have just in case we need it.
What do you say?
Sincerely,
Frustrated in Fresno
Dear Frustrated –
Thank you for your letter. You are doing a kindness for the millions of Americans who were sitting at their computer screens last night, at midnight, with only hours to go before the big presentation, inserting numbers, stacks, pies, and trend lines into their PPT decks. They know the decks are too dense, and that even the math whizzes in the room will not understand the key messages, but they rationalize the mayhem by saying to themselves, “This is so important we can’t leave it out. What if they ask a question about this stuff and we can’t answer it? Overkill is better than looking stupid.”
Here’s my prescription to stop the “Data Dump” madness.
First, step away from the mouse! The computer mouse, that is. Your team should sit in front of a whiteboard and use a Dry Erase marker to storyboard your content, flow, and key messages. Then you are better prepared to make good decisions about data, findings, and other sources of information to incorporate into your final deck.
Second, have you ever heard of an appendix? Put anything you want in that section. Go crazy. And when a question comes up, refer the audience to page 347 where they will find all the helpful charts, graphs, and tables they would ever need to get a complete answer to their question.
Third, do you know what the average attention span is in the 21st century? Short. Really short. Based on current research, it’s anywhere from 7 to 11 minutes. So why risk losing it? Don’t you want your audience to resonate with your “unique value proposition” in order to choose your company out of all the potential vendors? How else do expect to get a “Yes?”
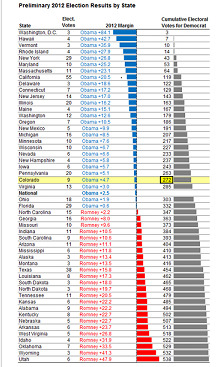
Fourth, do you know what a compelling chart looks like? Get rid of the cutesy 3D, delete most, if not all of the gridlines, include lots of white space, and use color to enhance the important information. Take a look at this chart from Nate Silver of FiveThirtyEight (now part of ESPN). Even the “Galileo of Graphics” Edward Tufte voted it the best data chart of the 2012 presidential election. That’s a lot of data to get onto one slide. I can’t imagine your team has more to display than this. Take a lesson from Nate and simplify without distorting.
Fifth, do you remember that old adage from elementary school grammar? When in doubt, leave it out. Your audience is going to make their decision based on how well they clicked with you, not how much data you provided. So step up and be the show. Don’t let a dense, noisy, and confusing PowerPoint deck upstage you!
– Barbara
